

Candlestick Pattern in stock Market
In this article we will learn, What is Candlestick Pattern in Stock Market?
What are the candlesticks, How to use them? Are these candlesticks reliable?, There are lots of questions comes into everyone’s mind. well, the answer is here.
Candlesticks are also known as Japanese candle sticks, used by technical analyst to predict the movement of the stock. It can also apply on shares, commodity or Currency. It was originally discovered by Munehisa Homma, a Japanese farmer in 18th century, later on steve Nelson intruduced them to the world by publishing a book on Candlestick known as Japanese candlestick charting Techniques in 1991.
Classification of Candles
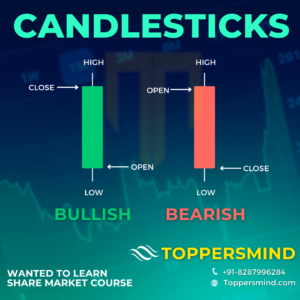
Candlesticks can be divided into two main categories known as Bullish candlesticks and Bearing candle sticks.
Bullish Candle Sticks : Bullish candle is shown as Green color or white color represent demand in the market and shows upmoves.
Bearish Candlesticks : Bearing candle is display as Red color or Black color represent fall in the market and shows downside movement.
Application of Candlesticks:
Candlesticks can be apply on any time frame like Monthly candle, Weekly, daily or Hourly candles. There are shorter timeframe like 30min, 15min, 5min, even 1 min Candle used by Technical Analyst. Candles can be applied on Shares, Index, Commodities, Forex or currencies Charts.
Components of Candle:
Candles are use to see the price action with in a time frame. A candle has four component like opening price, low, high and Closing price. during a time frame what data shows the open, lows, high and closing price of security. if open price is greater than closing price red candle or bearing candle forms and if closing price is greater than opening price a green candle or bullish candle form.
Some famous candles are given below:
Some of the famous single candlesticks are Hangingman, Hammer, Inverted hammer, Doji, Hangingman, spinning topetc. Two candle patterns are bullish engulfing, bearing engulfing, bulish harami, bearish harami, twizer tops etc. There candle patterns are three white soldiers, Three black crow, Morning star
Follow us On: Facebook, Twitter
To Know More About Share Market Course